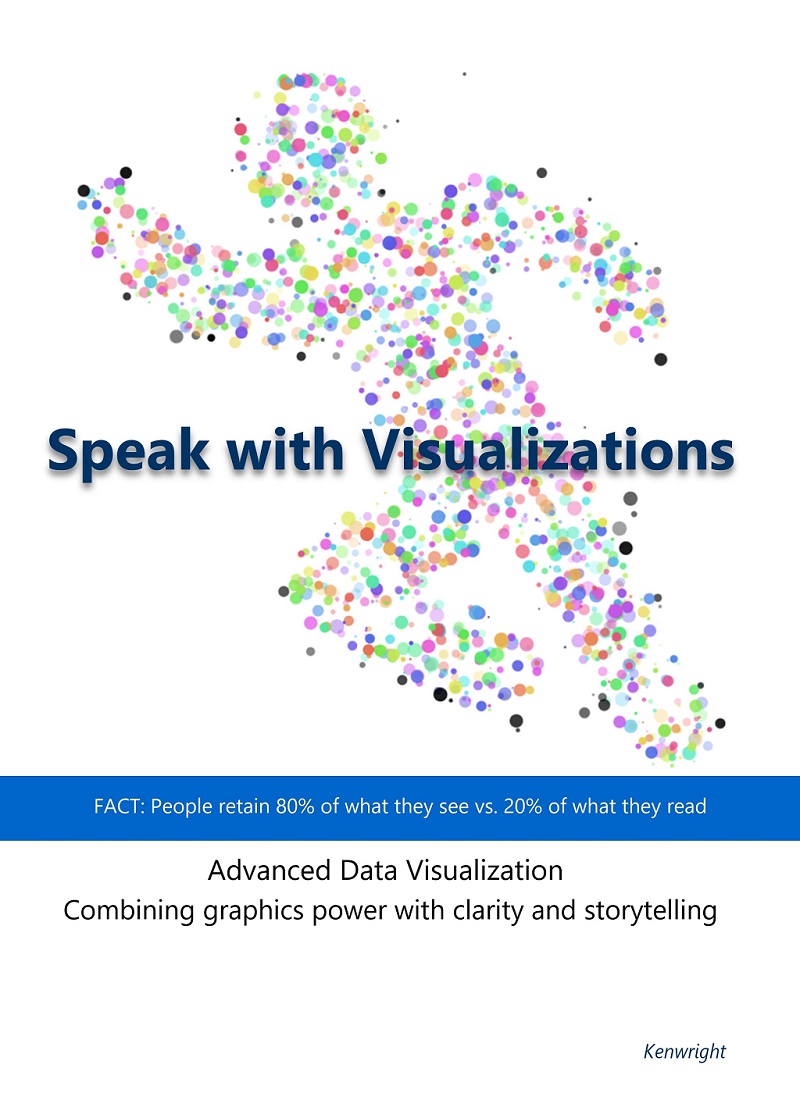
Speak with Visualizations
By Various Authors
$29.99
Available now
ISBN: 979-8282625813
Publication Date: May 5, 2025
About This Book
This book was born from countless late-night debugging sessions. I lost track of how many times I wrestled with graphical dashboards that almost worked - the data was accurate, the charts were colorful, yet the users kept asking, "So what?" Those long hours led me to a truth: Technical mastery of visualization tools means nothing without an equal command of human perception and analytical storytelling.
It's not enough to simply display data; we have to make it meaningful. A well-designed visualization should do more than inform - it should guide the viewer to insight, helping them see patterns, spot outliers, and grasp the bigger picture. Over time, I realized that the best visualizations are bridges between raw numbers and human understanding, blending art and science to turn data into decisions.
Those nights of trial and error sharpened my obsession with one question: How do we make data not just visible, but valuable? This book is my attempt to share what I've learned - practical techniques, psychological principles, and real-world examples that can help anyone transform dry statistics into compelling stories. Whether you're a data analyst, a business leader, or just someone who loves a good data visualization, my hope is that these lessons will help you create visuals that don't just sit on a screen, but spark action.
But insight doesn't happen by accident. The most effective visualizations are intentional, designed with the audience's needs - and limitations - in mind. Cognitive biases, attention spans, and even color perception all play a role in whether a chart enlightens or confuses. That's why this book doesn't just teach how to build visualizations; it explores why certain designs work and others fall flat. You'll learn to anticipate the questions your viewers will ask - and craft visuals that answer them before they're even spoken.
The tools we use matter, but they're only part of the equation. A stunning infographic in the latest software can still miss the mark if it prioritizes style over substance. That's why I focus on principles that apply whether you're working with Excel, Python, or a whiteboard. The best visualizers aren't defined by their toolkit - they're defined by their ability to think critically about data and communicate with clarity.
And let's be honest: Data can be intimidating. For many, a spreadsheet full of numbers feels like a locked door. A great visualization is the key - one that doesn't just reveal the data, but makes it inviting. That's the magic of this craft: taking something complex and making it feel intuitive, even obvious. When done right, a visualization doesn't just present facts - it tells a story that resonates, one that sticks in the mind long after the screen goes dark.
So consider this book a challenge - to move beyond default charts and lazy defaults, to treat every visualization as an opportunity to change how someone thinks. Because in a world drowning in data, the ability to make it clear, compelling, and human isn't just useful - it's indispensable.
What You'll Learn
- Master practical coding skills.
- Explore real-world projects.
- Accelerate your learning curve.
- Demystify advanced technical topics.
- Gain insights from real-world case studies
- Access downloadable code examples
- Learn best practices from industry experts
I've purchased copies for all my colleagues - that good!
Who This Book Is For
This book is perfect for developers, engineers, and technology enthusiasts who want to deepen their understanding. Whether you're a beginner looking to get started or an experienced professional seeking to expand your knowledge, this book provides valuable insights for all skill levels.
Latest News
Book Awards Mar 18
Nominated for Best Technical Book 2023 by Tech Publishing Association.
Special Discount May 23
Limited-time 30% discount available for newsletter subscribers.
Author Interview Apr 13
Read our exclusive interview with the author on TechBooks Blog.
Reader Meetup May 30
Join our virtual book club discussion next Thursday at 7PM EST.
Where to Buy
Customer Reviews
4.7
Based on 1,245 reviews
Bootcamp Grad
Verified Purchase • March 9, 2025
The step-by-step approach made complex topics accessible. I went from zero to building real projects thanks to this book!
Podcaster
Verified Purchase • March 18, 2025
Hands down one of the best resources available. The author's expertise shines through every chapter.
Author
Verified Purchase • March 14, 2025
I rarely give 5-star reviews, but this book deserves it. The depth of coverage is impressive without being overwhelming.
Software Architect
Verified Purchase • April 7, 2025
I've been in this field for years, but this book still managed to teach me new approaches. Highly recommended for both beginners and experts.
Bootcamp Grad
Verified Purchase • May 6, 2025
The step-by-step approach made complex topics accessible. I went from zero to building real projects thanks to this book!
Product Details
| Publisher | Tech Publications Inc. |
|---|---|
| Publication Date | May 5, 2025 |
| Language | English |
| ISBN-10 | 979-8282625813 |
| ISBN-13 | 978-8282625813 |
| Pages | 410 |
| Dimensions | 7.5 x 1.2 x 9.2 inches |
| Weight | 2.9 pounds |


